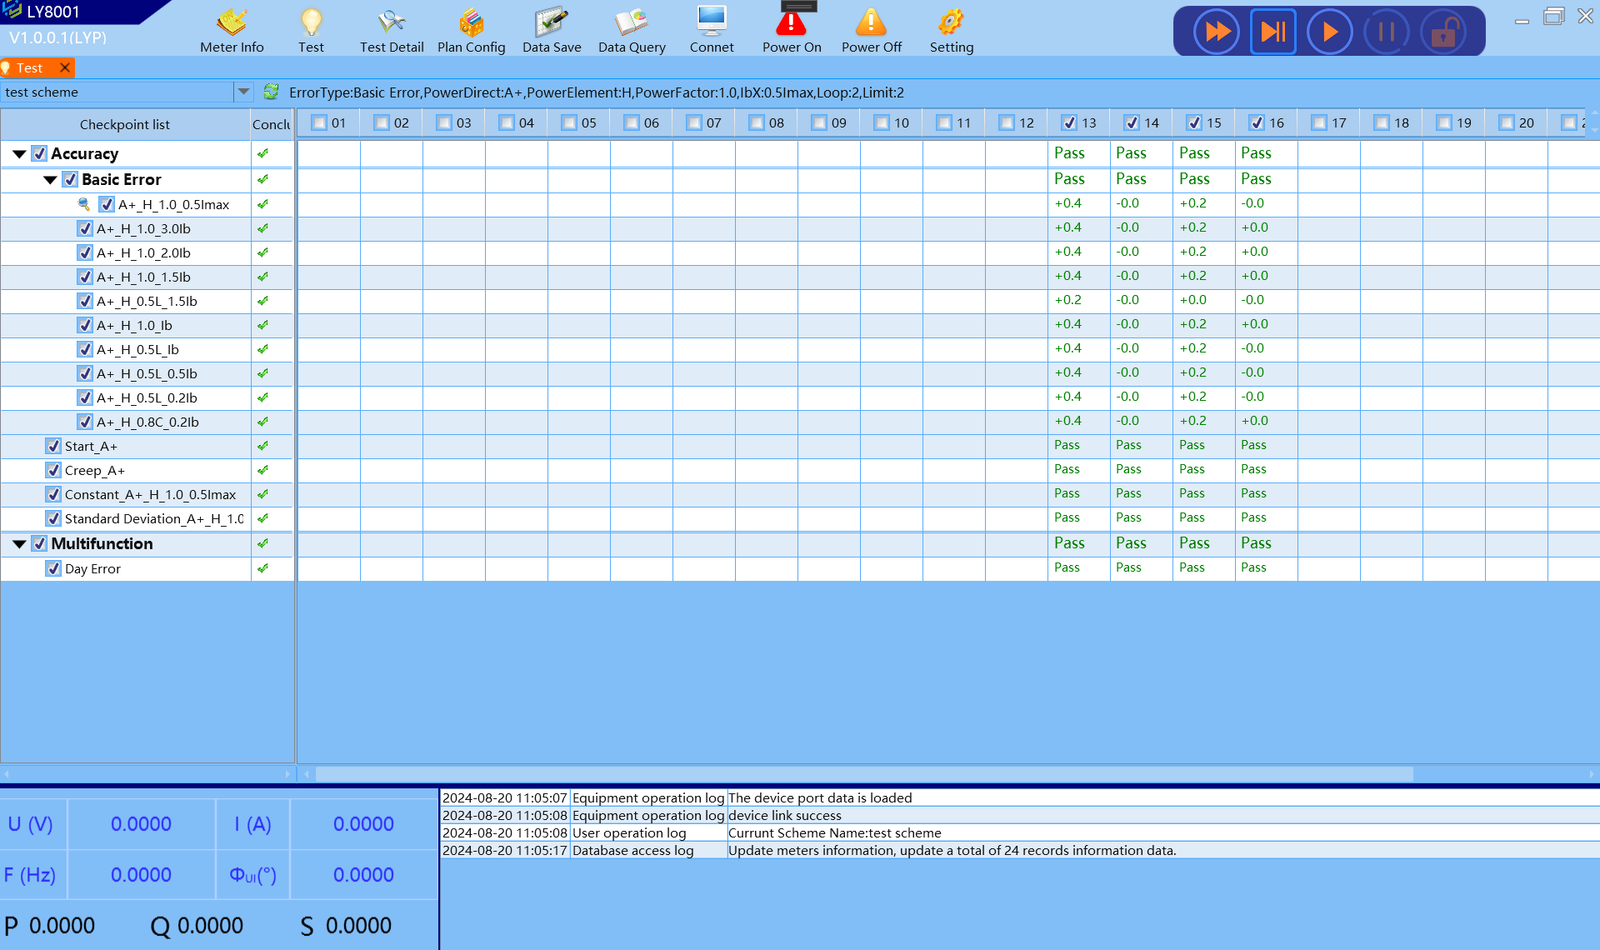
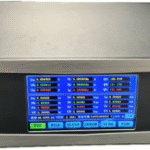
Meter Info button: opens the parameter entry window, users can enter the information related to the inspected table.
Test button: opens the scenario tree and the conclusion network window and displays the summary data.
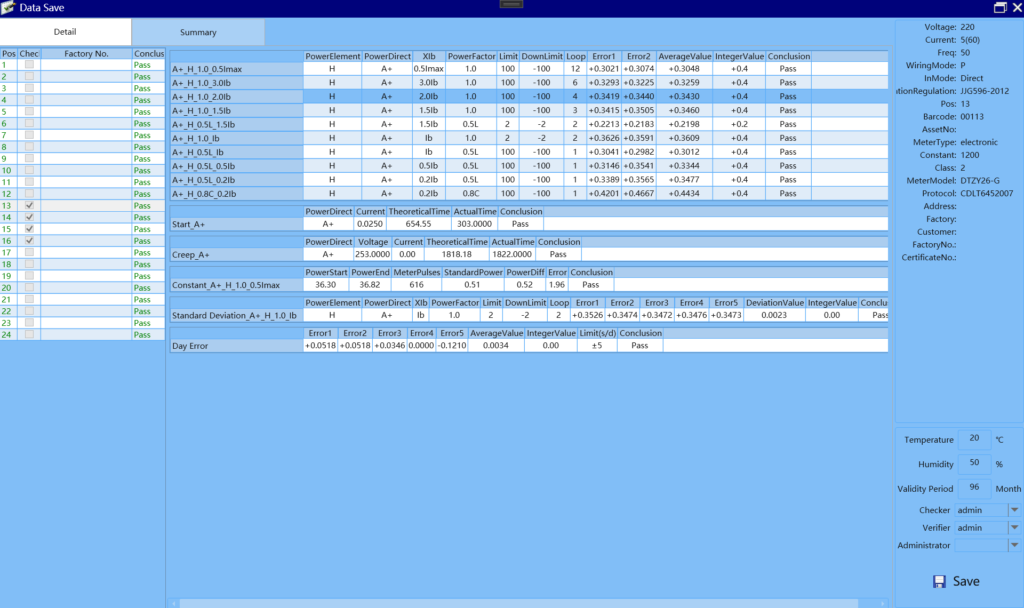
Test Detail button: opens the scenario tree and the detailed data window, users can view the detailed data of the current each test item.
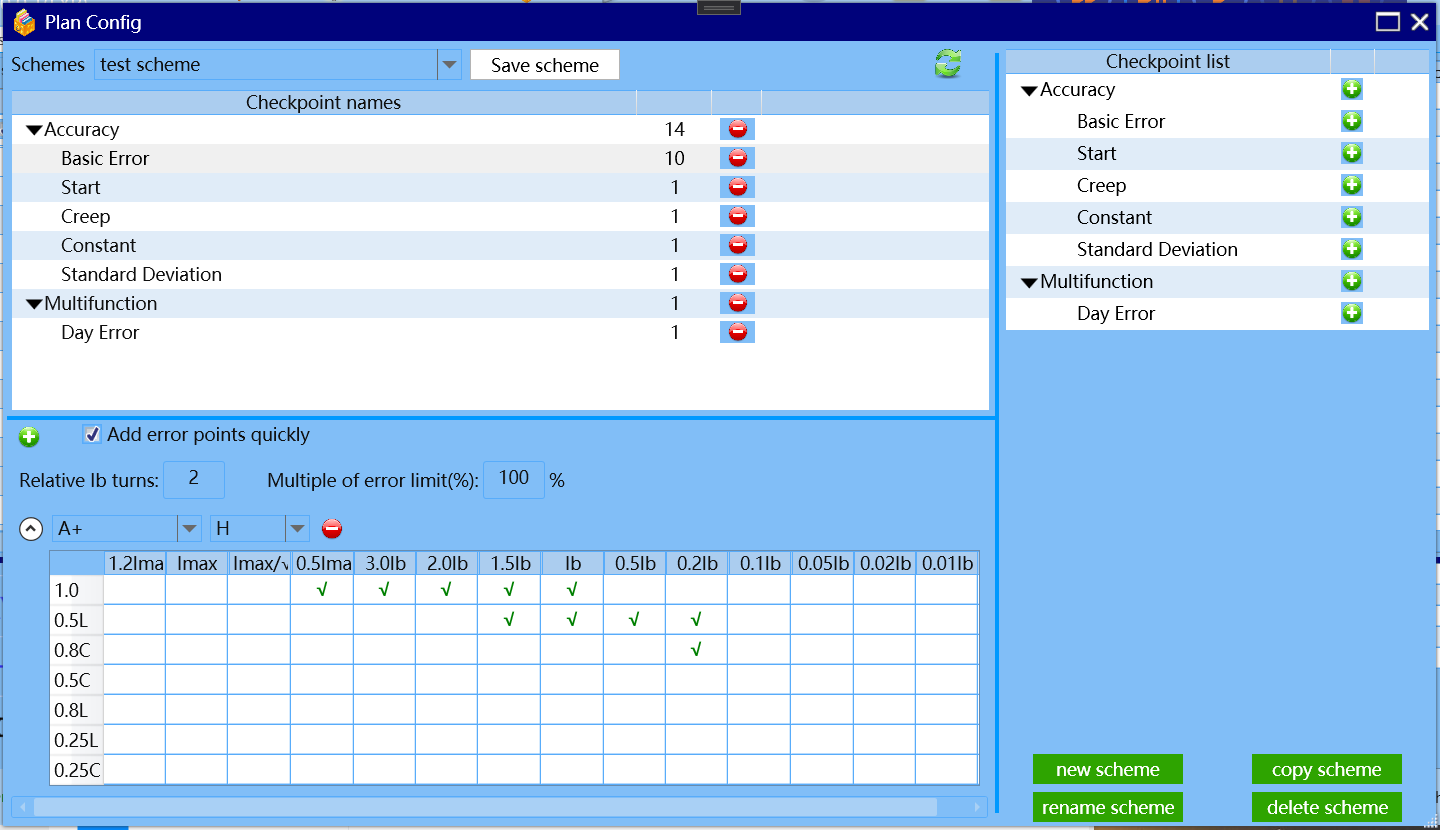
Plan Config button: opens the plan editing window, users can create, modify, and delete the plan and its content. Modify, and delete the plan and its content.
Data Save button: open the data save window, and you can enter the saved information, such as temperature, humidity, and other information.
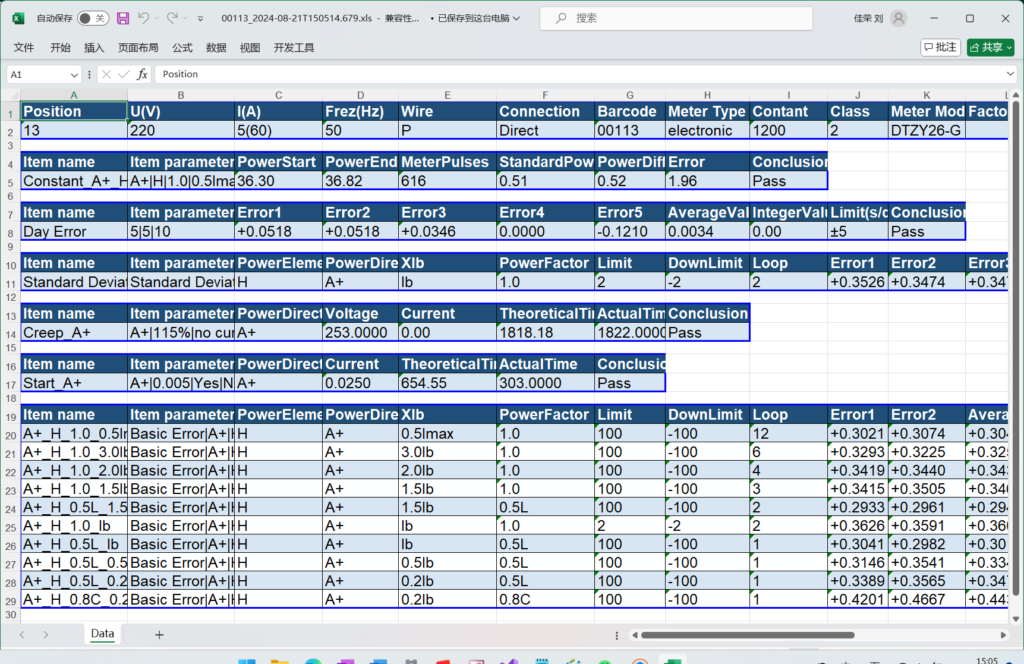
Data Query button: open the data query sub-application, and you can query and export the historical data.
Connect button: on-line operation, used to test the software and the test bench whether the communication between the normal.
Power On button: Increase voltage
Power Off button: Decrease voltage and current
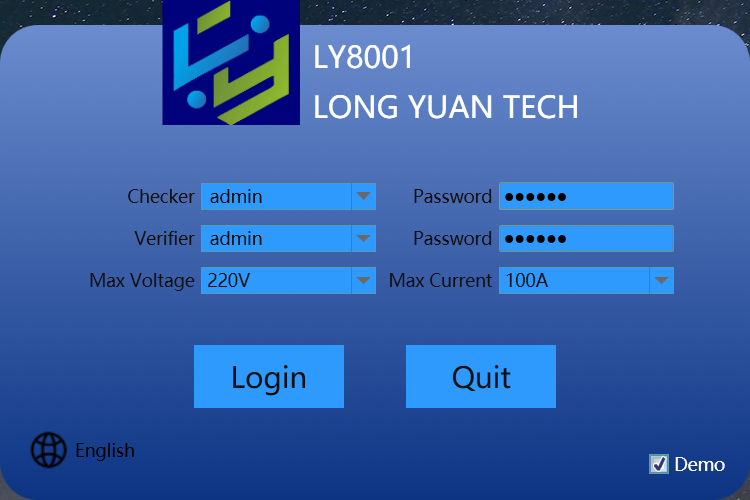
Setting button: Open the setting window.
Connect the check button to check from the currently selected checkpoint down to the last checkpoint.
The Group Connection Check button detects from the currently selected test point down to the last test point of the current group.
Single-step run button to run the currently selected detection point.
stop running
When locked, it will always run the current load point and will only be valid for individual tests, such as fundamental errors.
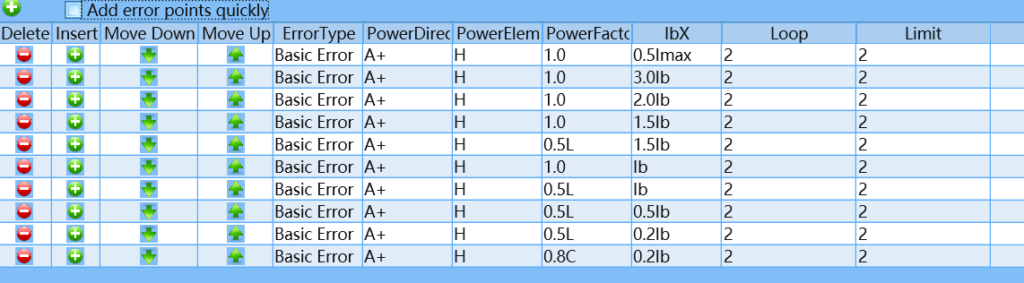
Quick entry, you can enter test points by checking the “Quick Add Error Points” box.
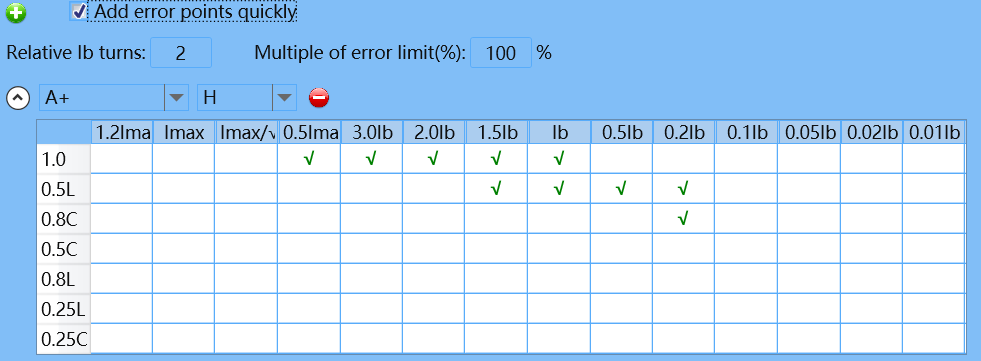
Quick entry, you can check the “Quick Add Error Points” to enter a list of test point error points, including error type (default basic error), power direction, components, power factor, current multiplier, number of pulses, error limit (±).